“The cost of housing is one indicator of the adequacy of the city’s housing supply, but it must necessarily be evaluated against the level and trend of household incomes to determine affordability. The correlation between area household incomes and housing prices is one of the strongest empirical relationships in real estate economics”
A declining housing affordability raises the possibility that neighborhood environments become more polarized because the lower-income households could not afford to live in the same neighborhoods as the higher-income, leading to greater segregation of the most well-off. A neighborhood income sorting can potentially generate even larger disparities in neighborhood conditions and services, in terms of exposure to crime and lack of access to good-quality services and facilities. (NYU 2014, 14) According to the U.S. Department of Housing and Urban Development’s (HUD) a housing unit is commonly considered affordable to a household if it rents for less than 30 percent of the household’s monthly income.
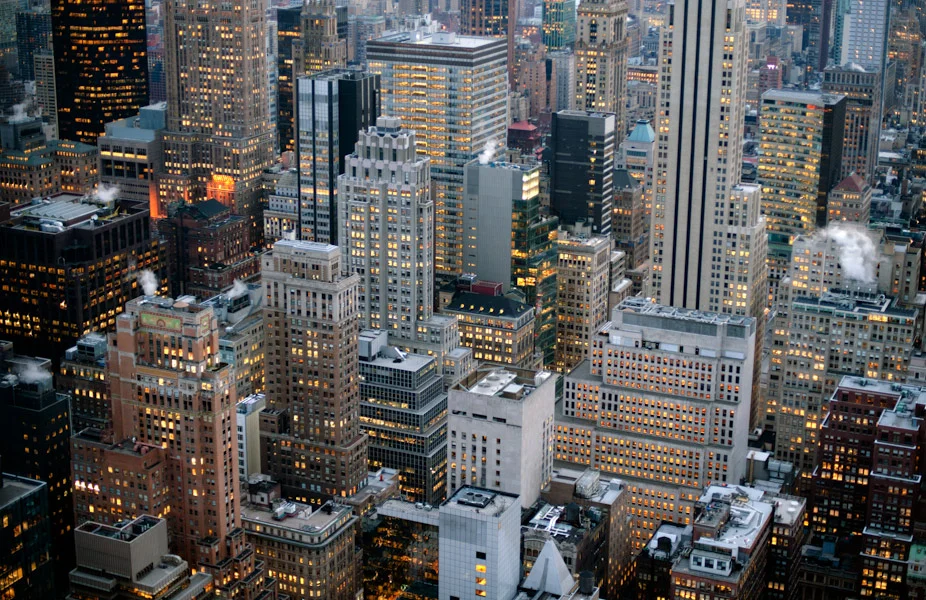
Manhattan
NYC: Amsterdam Avenue and Upper West Side - Source: Ben Leshchinsky
The data shows that Manhattan has the second greatest number of occupied housing units paying rent (76%), with only the Bronx surpassing it (79%). Approximately half of the New York renter households (46%) are rent-burdened. While this may seems dire, it is better when compared to the general city percentage (52%) or the other boroughs like Brooklyn (53%) and Queens (54%). The only exception is the neighborhood of Inwood and Washington Heights with a median value of 54 percent.
A higher level of housing affordability can be easily explained through a better match between the rent-to-income ratio, in fact the majority of the population is high and middle-income (60%), with a median income around 70,000 dollars per year.
It is also worth noting that the neighborhoods with the lowest median income per year, such as East Harlem (30,000 dollars) and Central Harlem (46,000 dollars) have some of the lower ranges of rent-burdened households within the city. In fact, a predominant low-income neighborhood finds affordable a median rent around 950 dollars.
Some of the reasons that could explain Manhattan polarization of middle and high income level are the large number of Manhattan’s rental housing units that were de-stabilized and converted to market rate in the last decade and the new constructions which primarily target a luxury market. Manhattan has the highest number of subsidized property units (65,000) of any borough, but in the last decade more than 27 percent is no longer subject to affordability restrictions. (NYU 2011, 7) In fact, unlike public housing, the privately owned subsidized properties are not permanently affordable. Owners may opt out of their affordability restrictions after a set number of years because the expiration of tax incentives or to the willing of the owner to convert the property to mark rate in order to realize potential profits (Stringer 2014, 19). At the same time the majority of newly constructed units is rented at a higher level of the means of the low-income renter due to the fact that new units are generally not subject to rent stabilization. This would explain why from 2000 to 2013, Manhattan saw a decline in the share of households with low and extremely low incomes and an increase in the share with high incomes, which justify the higher percent of population of middle and high income. (NYU 2014, 96) Manhattan households with incomes at the top of the city’s distribution are progressively being more spatially isolated than similarly households situated elsewhere in the city due to an increasing income segregation that doesn't allow diversity because of unaffordable rent options (NYU 2014, 96).
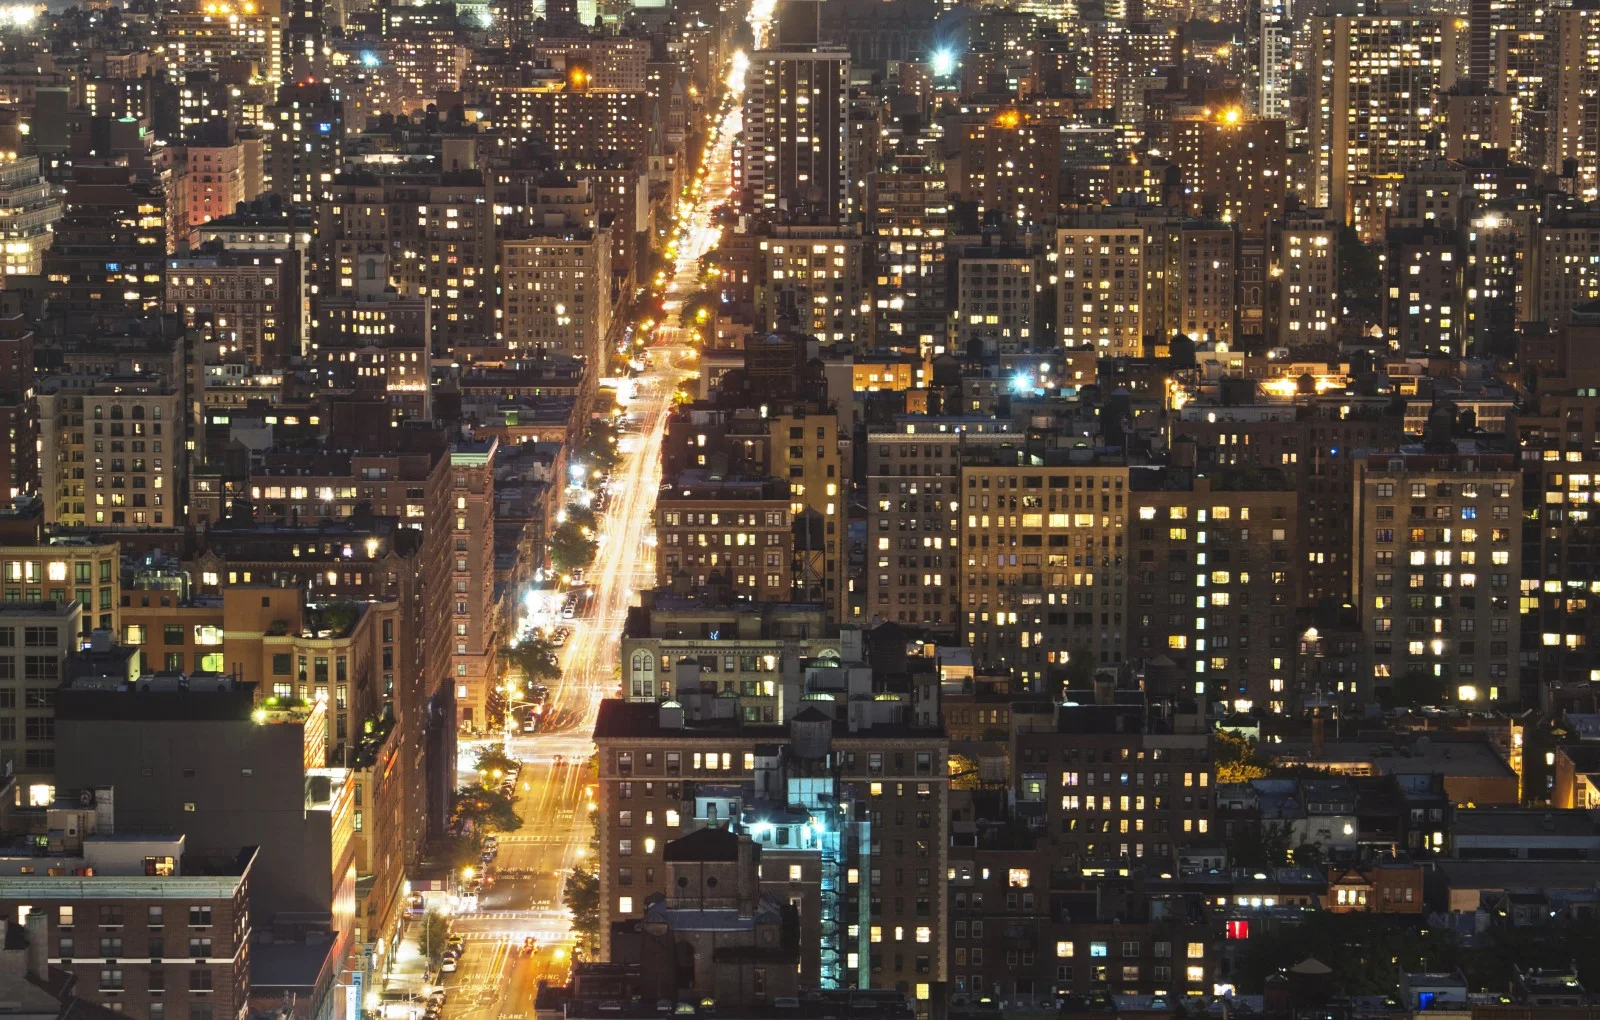
Brooklyn
Brooklyn has 68 percent of occupied housing units paying rents, but unlikely Manhattan (36%) only a small part of the population belongs to the high-income group (19%). In fact, despite the strong gentrification process that is transforming the borough characteristics, the data show that within a homogeneous distribution of the population between the three remaining income groups, the largest one is the extremely low income (28%). Of the five boroughs, Brooklyn had the largest number of housing started in 2013 and during the past 15 years and within the city the rents grew faster in Brooklyn (77%). (Stringer 2014, 5) The 53 percent of the households in Brooklyn pay an unsustainable rent. The values vary significantly between neighborhoods: from the 38-40 percent of Northwest Brooklyn to the 58-60 percent of areas as Borough Park and Sunset Park. The process of gentrification can explain the disparities between different areas within the same borough. The city’s own community development efforts and the proliferation of retail services and other neighborhood improvements make the area become more valued by renters, since the number of private apartments that rent at a discount because of undesirable neighborhood environments decrease and the number of middle or high-income households increase. (Stringer 2014, 15-18)
Williamsburg - Source: LWYang
The expected results is that if the number of middle- or high-income households in a neighborhood increases, so will average rents. But the data show that while the median household income (94,000 dollars) in the gentrified areas is almost the double than the median income (43,000 dollars) of the areas with the highest values of rent-burdened households, the rent gap is definitely lower, whit a difference of just few hundreds dollars.
It is interesting to note that the neighborhoods whit the worst level of affordability in 2013, such as Bushwick and Williamsburg (56%), Sunset Park (59%) and Borough Park (61%), are the ones that are currently facing the process of gentrification, while the neighborhoods with the best values correspond to the areas that already completed the process of gentrification and in which the majority of the households belong to the middle- and high income groups.
The gentrification process has created a scarcity of affordable housing, forcing the low-income households and below to displace, with strong impacts on the neighborhoods and borough composition.
This means that the distribution of the extremely low- and highest-income households in Brooklyn is becoming more income segregated: they are more likely to live in neighborhoods with similar incomes households. (NYU 2014, 74)
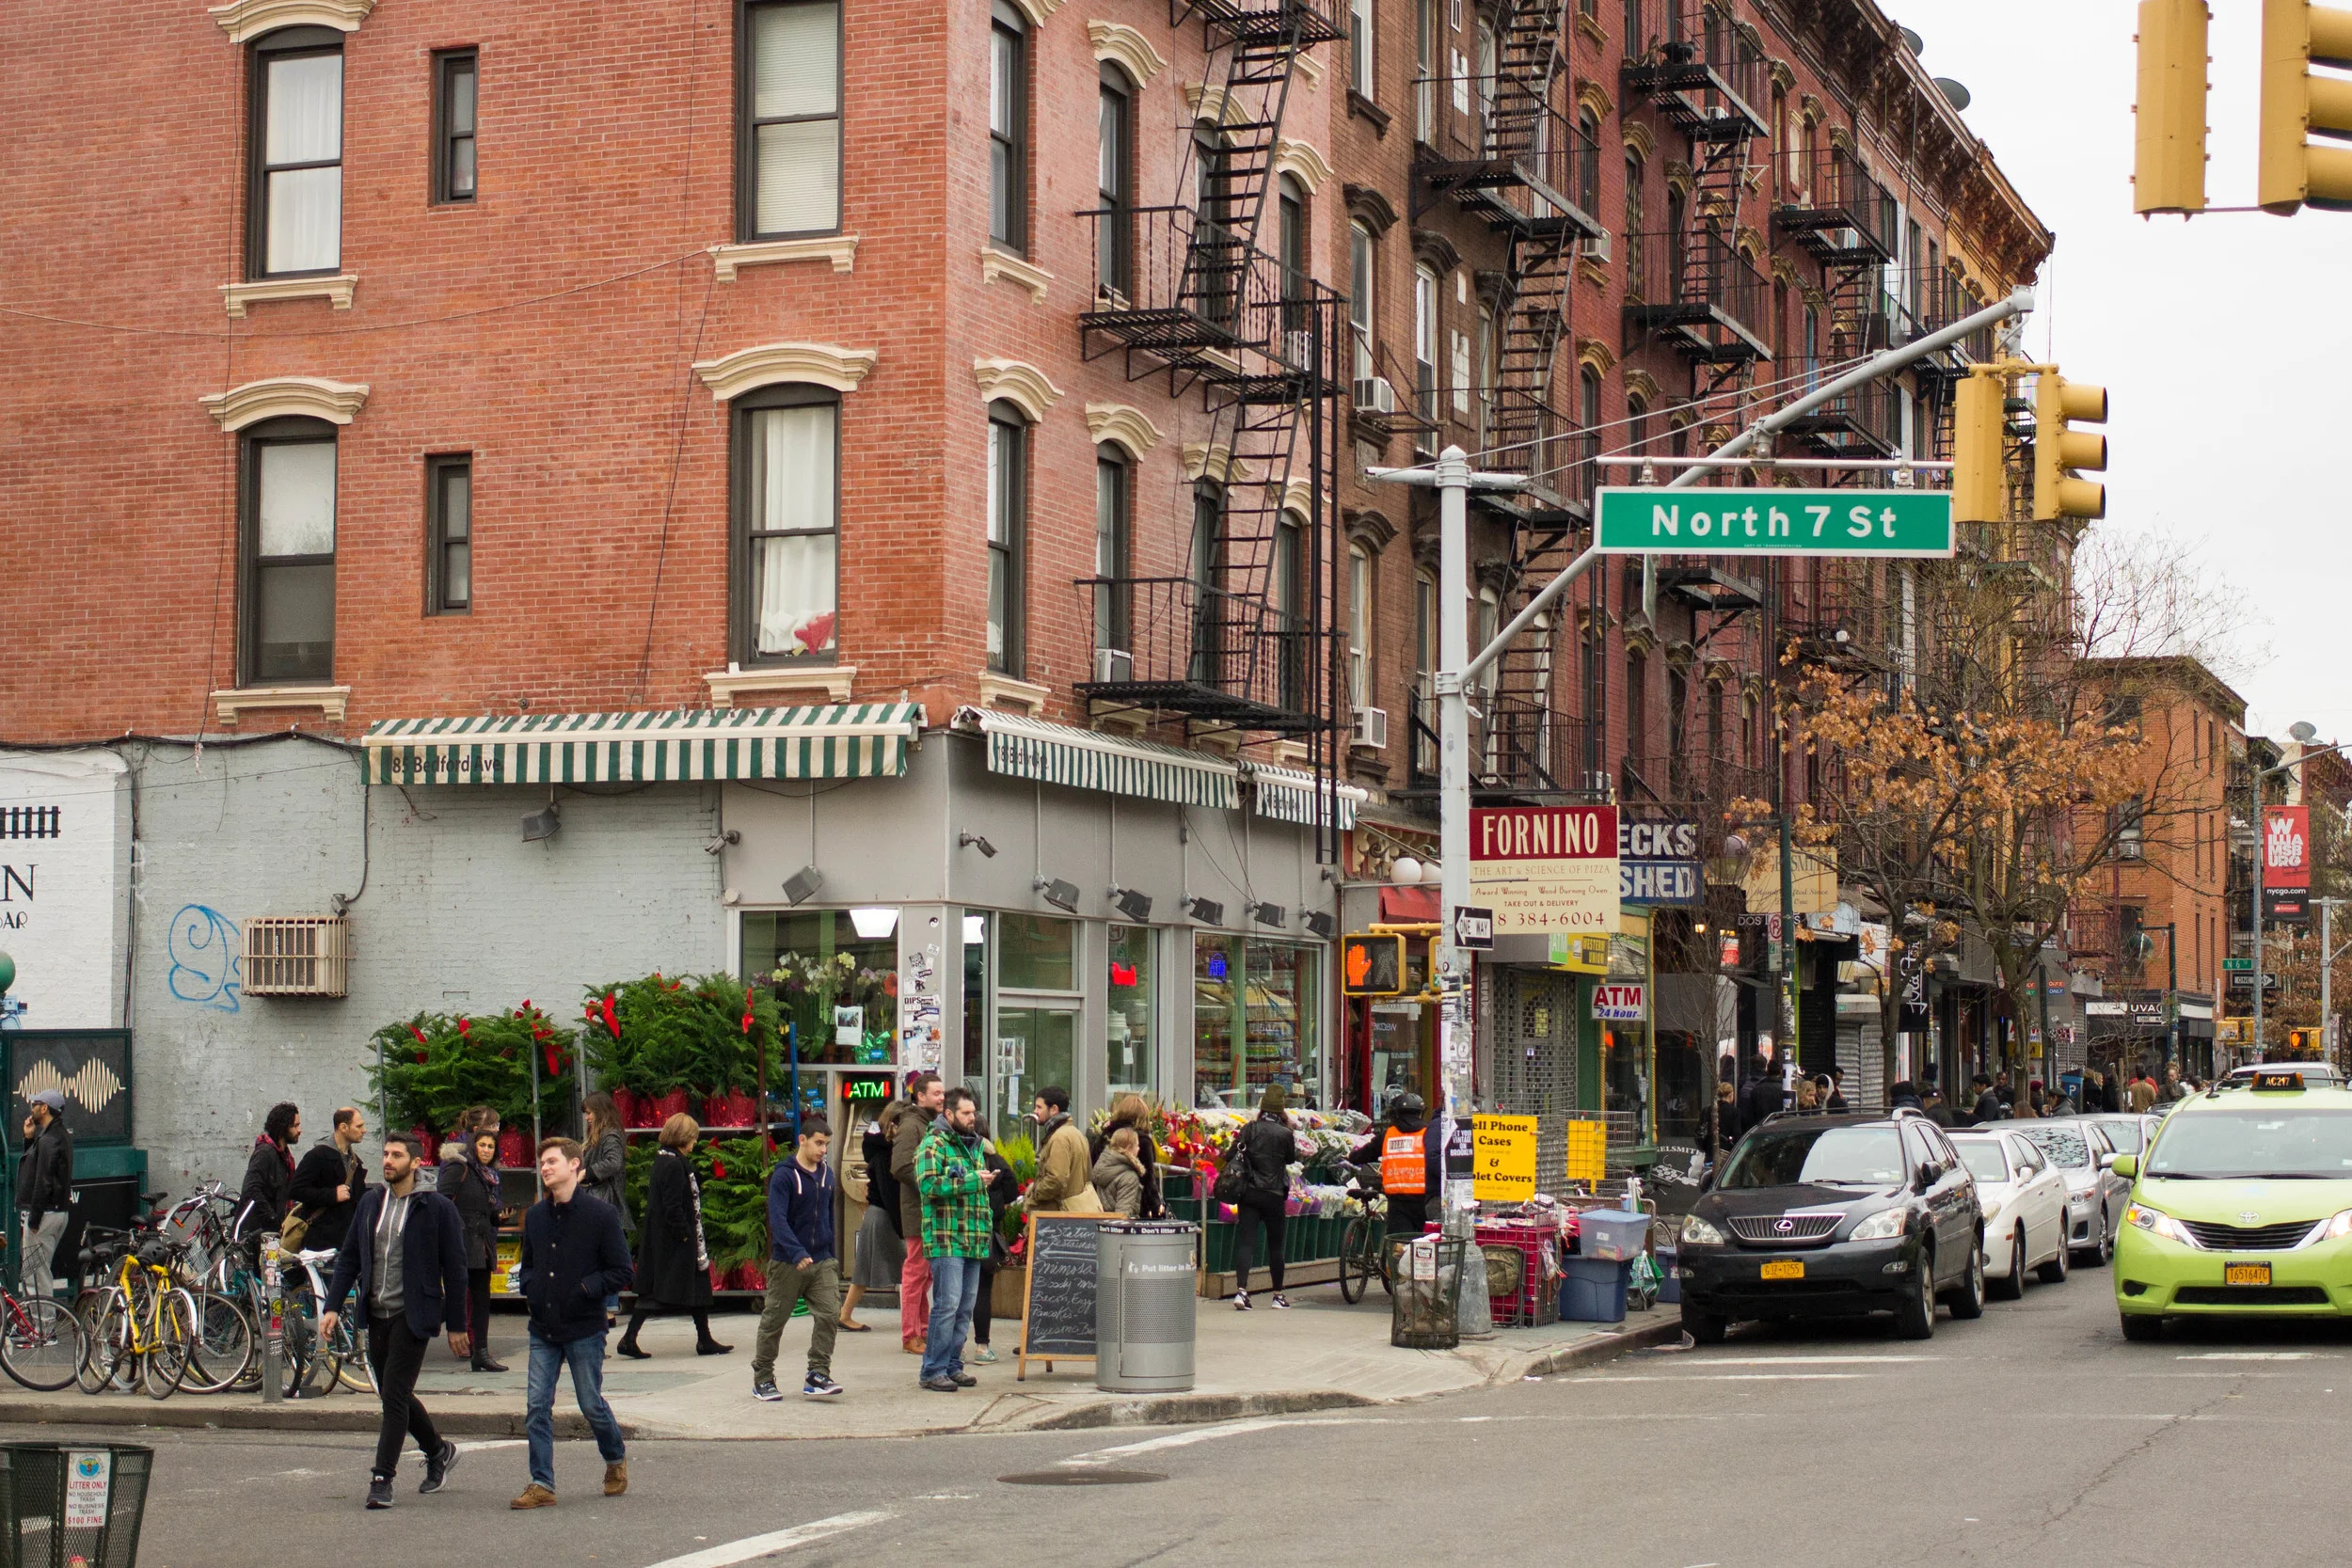
Queens
As the largest in area and the second most populated of the five boroughs, Queens has almost half of the borough units rented and the second highest share of severely rent burdened households (54%). Even with almost a half of the population middle income and a great vastness of its territory, the reasons for the affordable housing crisis can’t be fully explained at the borough level and must be searched differently for each neighborhood. For example, in Northeast Queens the median income (100,000) and the median rents (1,600) are higher than the average, but there is the lowest availability of rental units. This is due to upper middle class neighborhoods with a majority of privately owned detached houses, which represent a pocket of higher welfare compared with the rest of the borough. The neighborhoods closest to the ocean instead, characterized mainly by summer resort properties, were heavily affected by the Hurricane Sandy in 2012. (Colangelo 2014) The higher values of affordability in this area relate to the struggle of the displaced residents to rebuild their homes and the consequent collapse of the housing market after the storm.
On the other side, the neighborhoods that belong to lowest values of housing affordability, like some areas in Brooklyn, are the ones that are starting to face the gentrification process. The West Queens and in particular the area of Elmhurst, Jackson Heights and Woodside as well as Jamaica neighborhood are slowly becoming a vibrant hub with new upscale apartment buildings, art centers, hotels and tourists. The real estate market since 2013 started to pay attention at Queens, looking for opportunities to bring new popularity at these places as it happened with Brooklyn from 2011. The picture of the new tenants is a mix of Manhattan immigrants and middle- and high-income Queens residents looking for an upgrade and people from Brooklyn that were priced out by the earlier process of gentrification. The data show that the process of gentrification in Queens is growing, causing a decline of affordable housing and rents increasing.
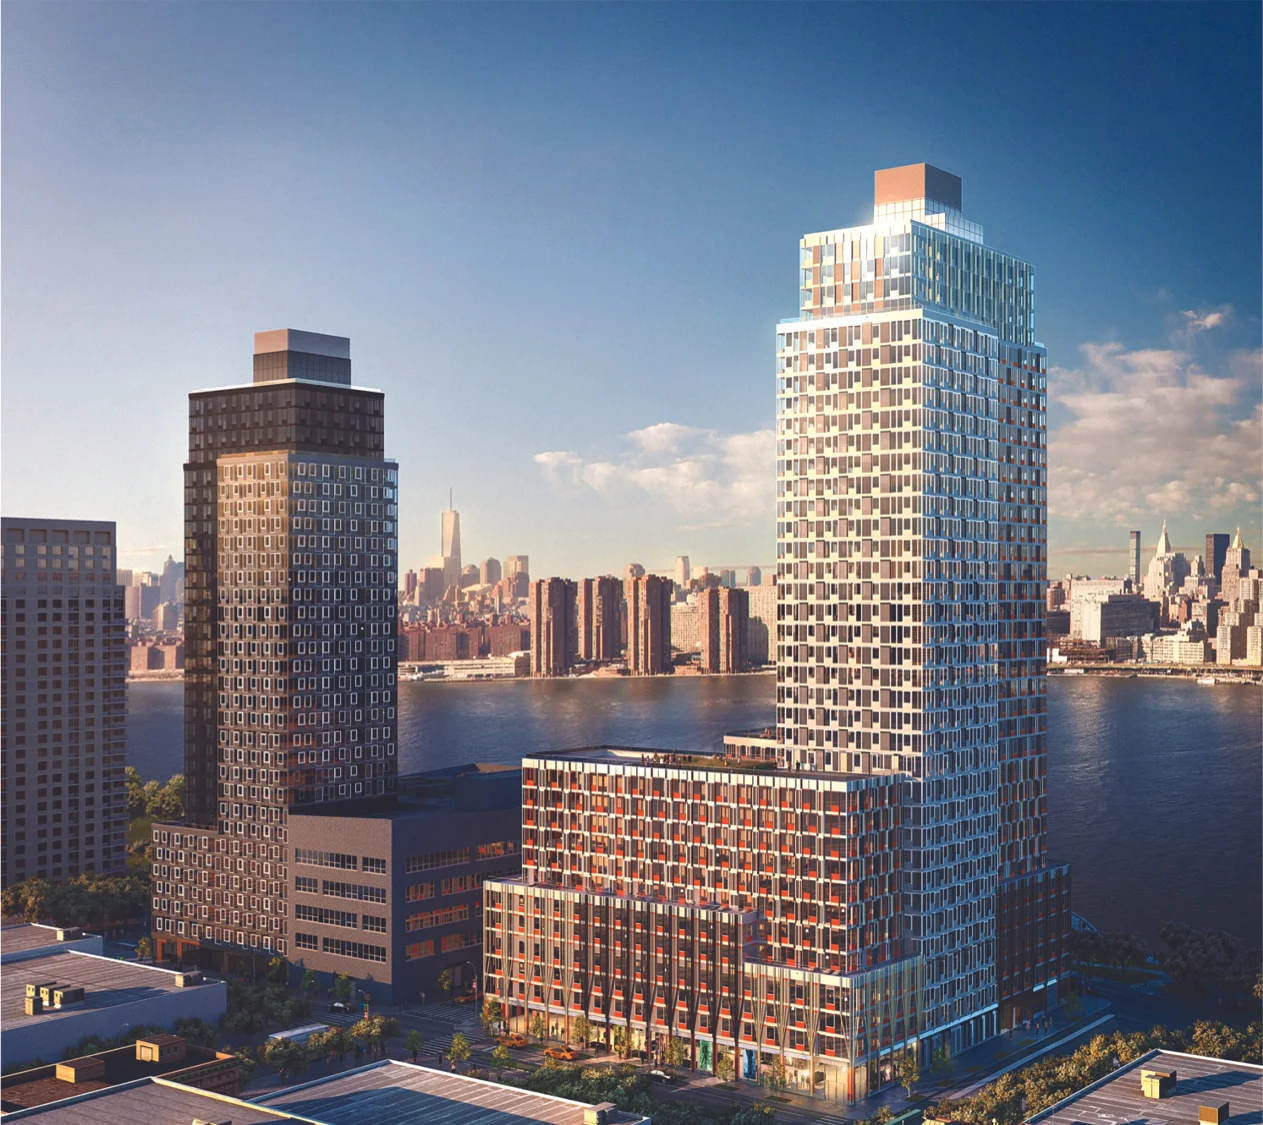
Hunter's Point South, render image.
The Northwest Queens neighborhood instead represents a peculiar exception: with the 49 percent of rent-burdened households, a higher level of rented units and median income than the borough, seems to have a more balanced situation than other close neighborhoods. The priceless location, looking at Manhattan from the other side of the East River, and the affordable prices of the land, favored the flourish of several mega-projects. Both the previous and the new elected city’s Mayors approved in the last 3 years the development plan of a controversial 1,723-units project on the Queens waterfront in Astoria and Long Island city. Both the megaprojects have a focus on affordable housing, in the first case 460 out of 1,723 units will be reserved as affordable housing, while in the second almost half of the 5,000 units will be priced below the market rate. The development will bring schools, retails, restaurants and waterfront parks thank also to the financial contribution of the city itself that will spend millions on the general upgrading of the area. (Rosenberg, 2015)
Bronx

Roof Works - Source: Eelus
The borough of Bronx has the highest number of rental units (79%), as well as the highest level of extremely low-income households, which means that the 38 percent of population earn less than 25.000 dollars annually – the largest share among the five boroughs. With the lowest median income and the lowest median gross rent of the city, the Bronx theoretically should be the most affordable borough, but the reality showed by the data is that in the Bronx, the majority (57%) of the renter households are rent-burdened.
This represents a full-blown crisis of affordability. “Of the five boroughs, the Bronx had the largest share of subsidized housing and rent-stabilized or rent-controlled housing in 2012. Nearly one-quarter of rental housing units in the Bronx were public housing or received other income-restricted subsidies, and an additional 55 percent were rent-stabilized or rent-controlled. Only a little over 20 percent of rental units were market rate—free of subsidies or rent regulation.”(NYU 2014, 58) But apparently the great amount of subsidized housing and rent-controlled housing is still not able to resolve the severe lack of housing with sustainable rents.
Preserving the housing affordability is thus important not only for the low-income families which are priced out of other areas, but especially for the current residents, since everyday a greater portion of the population is becoming vulnerable to homelessness (UNHP 2013).
The main reasons behind the housing affordability crisis in the Bronx are the population growth and the increasing high demands for units, in large part due to immigration. In fact the population growth in the Bronx area is expected to be around the 14 percent in the next years, as estimated by the NYC Department of City Planning. As the urban land theory predicts, the population growth in an urban area will cause housing prices to increase. In the Bronx is happening the opposite process of gentrification: people with lower incomes than the current residents are moving from abroad, from other places of New York State and from the areas that are being gentrified, widening the income gap between the Bronx and the other boroughs and contributing to increase the income-segregation.
Also the poor quality housing contributes to rising rents. “Tenants are driven to leave deteriorating apartments and the high turnover leads to a larger and more frequent rent increases”. (UNHP 2013, 12) The Bronx is currently the last expanse of city accessible to the extremely low-income households in New York, but highly threatened by the affordability crisis.
Staten Island
Staten Island, located in the southwest part of the city, has the greatest number of owners (60%) out of the five boroughs. Despite the wealthy inhabitants, which are middle and high income, and the median gross rent cost not higher than 1.600 dollars, still more than a half of the households is rent-burdened. In fact, although Staten Island has the lowest proportion of renter households among the boroughs, some of its renters experienced severe cost burdens. The level of unaffordability (which vary from 40% to 67%) is one of the highest within the entire city.
The great disparity is mainly due to the fast growing immigrant population, the share of latino residents who in Staten Island increased over five percentage points from 2010 to 2012, more than in New York City as a whole. (NYU 2014, 130)
In the specific case of Port Richmond, which homes the city’s fastest growing immigrant population, the poor and immigrant households have an average income lower than 20.000 dollars due to the exploitative labor conditions, often in poorly regulated sectors. The medium-high price of rents and the lowest percentage of rent-stabilized or rent-controlled housing are the reasons that rely behind the huge number of rent burdened households, that often are forced to live in illegal basement apartments. The critical housing situation of the immigrants of Staten Island highlights the challenges that this isolated and growing population is facing.
With a ten years city plan and limited funding, it is essential that New York government recognizes the challenge of having to deal with a diverse set of situations and variables through the city and gives priority to the neighborhoods that require a more urgent intervention.
The analysis reveals the great diversity of situation that relies behind the crisis of affordable housing, according to different areas of the city. The analysis framework of analysis shows that through the combination of big data, related to each indicator, is possible to obtain a citywide global picture, together with a detailed zoom on each neighborhood and borough of the city. This allows to recognize the great level of diversity that characterizes each area of such a complex city, but also the different stage of criticality that marks each neighborhood.
The City established a new Mandatory Inclusionary Housing Program, applicable in all medium and high-density districts, to ensure that the housing market will provide in the next years a sufficient number of affordable units. The mandatory program will incorporate the existing voluntary program and will require that affordable units will remain permanently affordable in order to provide long-term stability (Glen 2014). Since the 1987 the Inclusionary Housing Program was providing density bonus to the developers who voluntarily decided to participate because the benefits obtained were higher than the cost of rent-restriction. The new Mandatory Housing Program instead forces the developers to provide affordable housing units when building any kind of new housing projects.
It means that developers will continue building only if able to absorb the cost by accepting a lower financial return or being able to make up the cost elsewhere.
“In this way, there is the risk to reinforce the current trend that sees the construction activity being heavily concentrated in Manhattan and in the neighborhoods of Brooklyn and Queens close to Manhattan and that is causing the great process of gentrification of these areas.”
In fact high-rise and mid-rise construction in New York are so expensive that they require high rents to generate a profitable return. The additional zoning density provided by the mandatory housing program will be valuable to developers in high rent neighborhoods, while in low rent markets is not likely to result profitable, unless complemented with subsidies. The small number of projects in other neighborhoods shows that developers don't expect market rents being high enough to generate a satisfactory return on housing development.
Bibliography
Colangelo, L. L. (2014). Queens residents still struggle to rebuild homes damaged by Hurricane Sandy two years ago. Daily News, 26 October 2014. http://www.nydailynews.com/new- york/queens
Glen, A. (2014). Housing New York: A five-borough, ten year plan. The City of New York, nyc.gov/housing
NYU Furman Center, The Institute for Affordable Housing Policy (2011). State of New York City’s Subsidized Housing: 2011. School of law. Wagner School of Public Service New York University, http://furmancenter.org
NYU Furman Center (2014). State of New York City’s Housing and Neighborhoods in 2013. School of law. Wagner School of Public Service New York University, http://furmancenter.org
NYU Furman Center (2015). Creating Affordable Housing Out of Thin Air: The Economics of Mandatory Inclusionary Zoning in New York City. School of law. Wagner School of Public Service New York University, http://furmancenter.org
Rosenberg, Z. (2015). A Guide to All the Megaprojects Transforming New York City. http://ny.curbed.com/archives/2015/04/28
Stringer, S. M. (2014). The Growing Gap:New York City’s Housing Affordability Challenge. New York City: Office of the New York City Comptroller, Bureau of Fiscal & Budget Studies
University Neighborhood Housing Program (2013). Nowhere to go. A crisis of affordability in the Bronx. http://unhp.org/pdf/NowhereToGo.pdf